Dynamic Analytics
The Dynamic Analytics Report offers affiliates more than 200,000 analytics across different filters visualizations, which they can leverage to gain more insight about the companies within their program.
Navigation
Affiliates can navigate to the Dynamic Analytics Report view by taking a few steps. First, Affiliates should click the “Reports” navigation menu item in the navigation bar at the top right of their M3 panel.

Once clicked, the Affiliate will be navigated to the Reports view. Affiliates can then click the “Dynamic Analytics” item in the Reports menu.
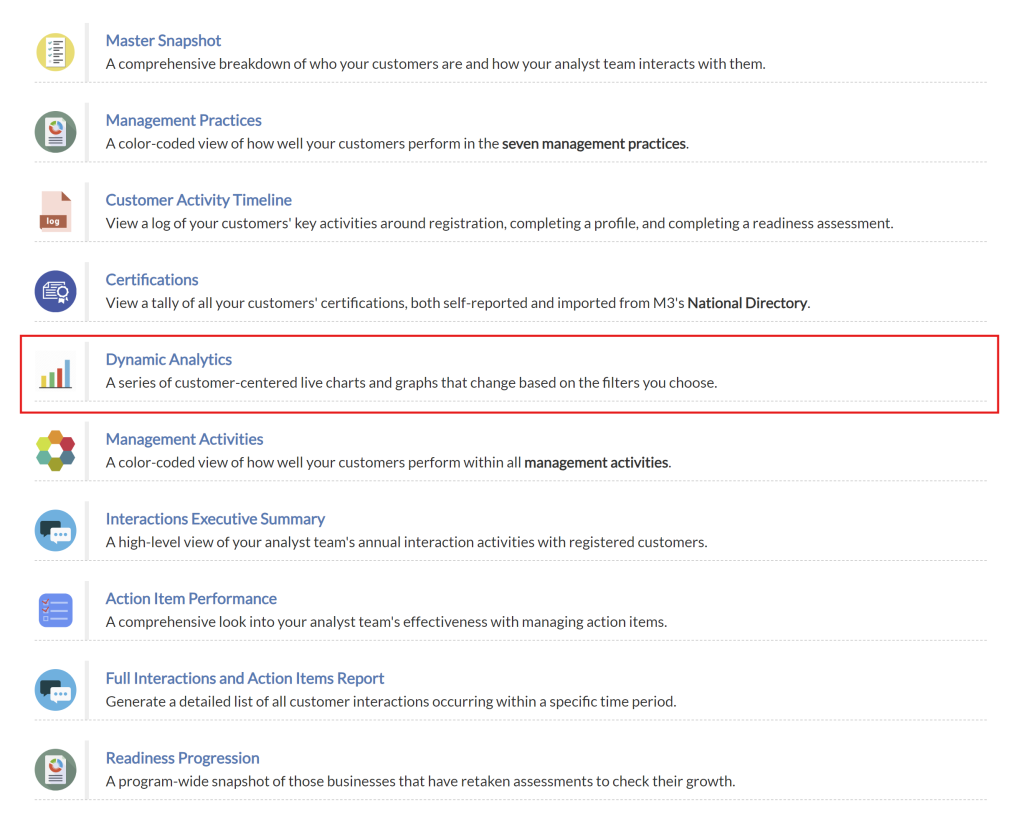
Upon clicking the “Dynamic Analytics” item in the Reports menu, Affiliates will be navigated to the Dynamic Analytics view.
Dynamic Analytics Overview
The Dynamic Analytics Overview section provides analysts with a snapshot of the companies they have been matched with and offers filtering options to access the appropriate information. This feature enables analysts to gain insights and tailor their analysis based on specific criteria.

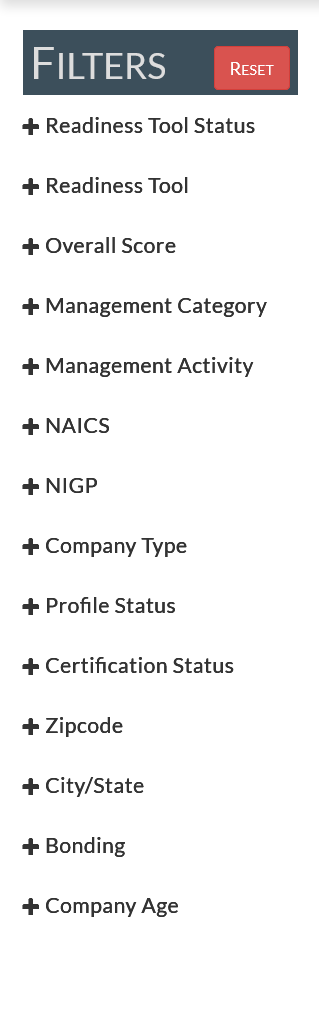
Dynamic Analytics Filters
The Dynamic Analytics Filters allow affiliates to change the scope of data populating their charts and graphs. By applying filters, analysts can narrow the focus of data and gain deeper insights into the information presented.
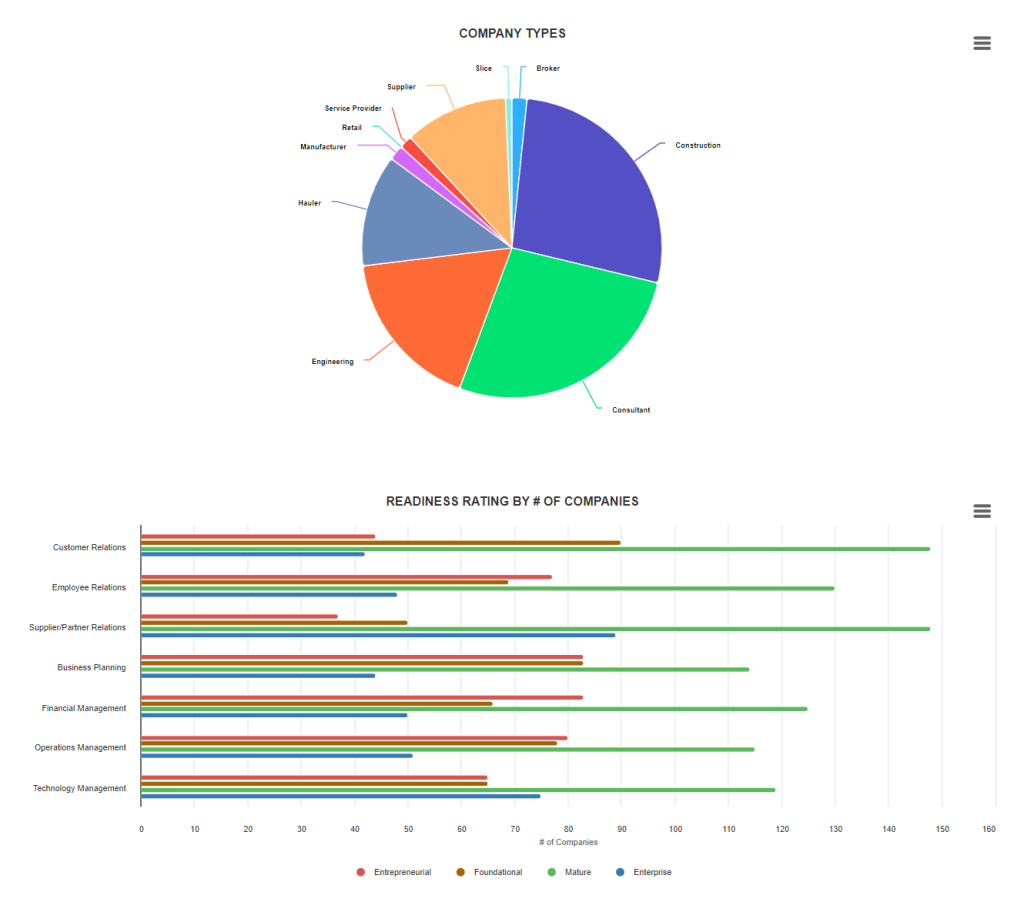
Dynamic Analytics Charts
The Dynamic Analytics Charts provide analysts with data visualizations based on the applied filters. Today, affiliates are offered the following visualizations to view program company data:
- Company Types
- NAICS Industries
- Readiness Rating By # of Companies
- Number of Interactions
- Age of Company
- Size of Company
- Revenue