Benchmarks
Benchmarking allows business owners to measure their company’s performance against industry leaders or similar businesses. Business owners can use these features to identify internal areas for improvement through a comparison with top performers and industry averages.
Navigation
Business owners can navigate to the Benchmarks view by clicking the “Benchmarks” navigation menu item in the navigation bar at the top right of their M3 panel.

Once clicked, the business owner will be navigated to the Benchmarks view.
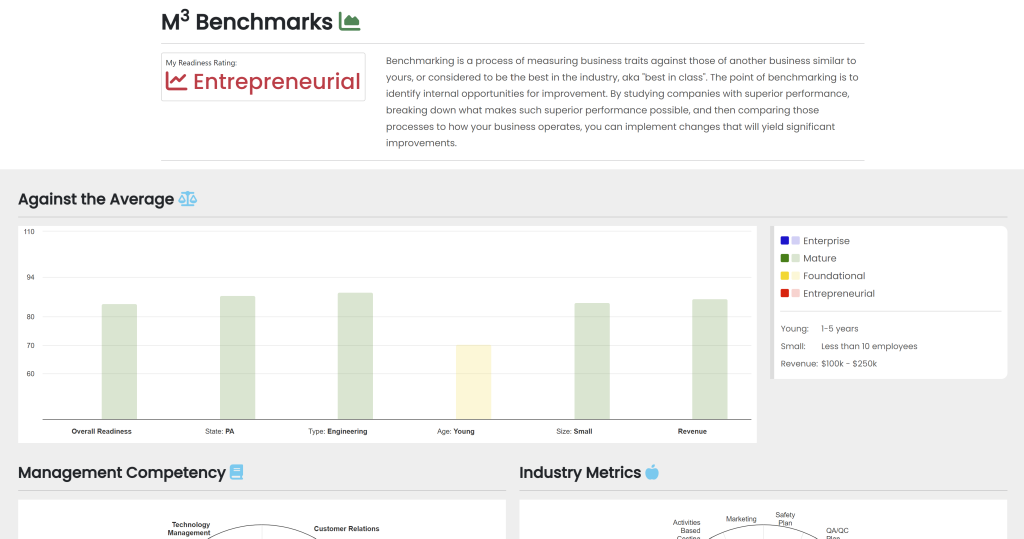
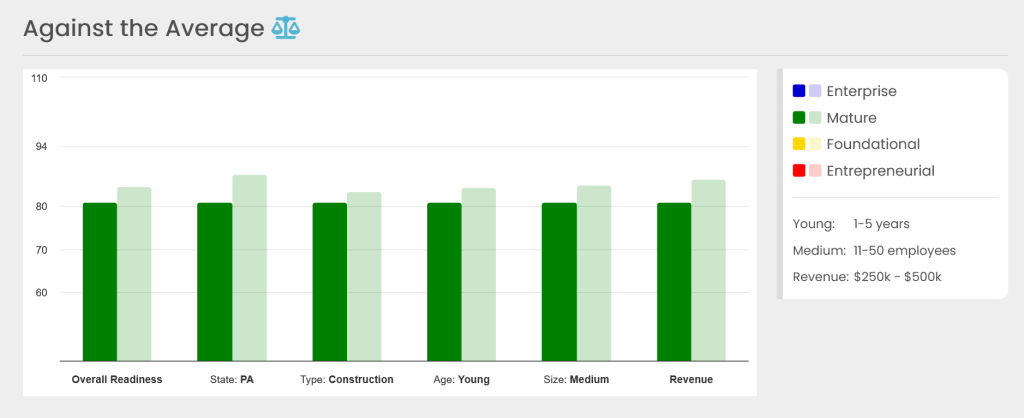
Against the Average
The Against the Average graph illustrates how the company compares with other companies in key areas such as:
- State
- Industry
- Age
- Business size
- Revenue value
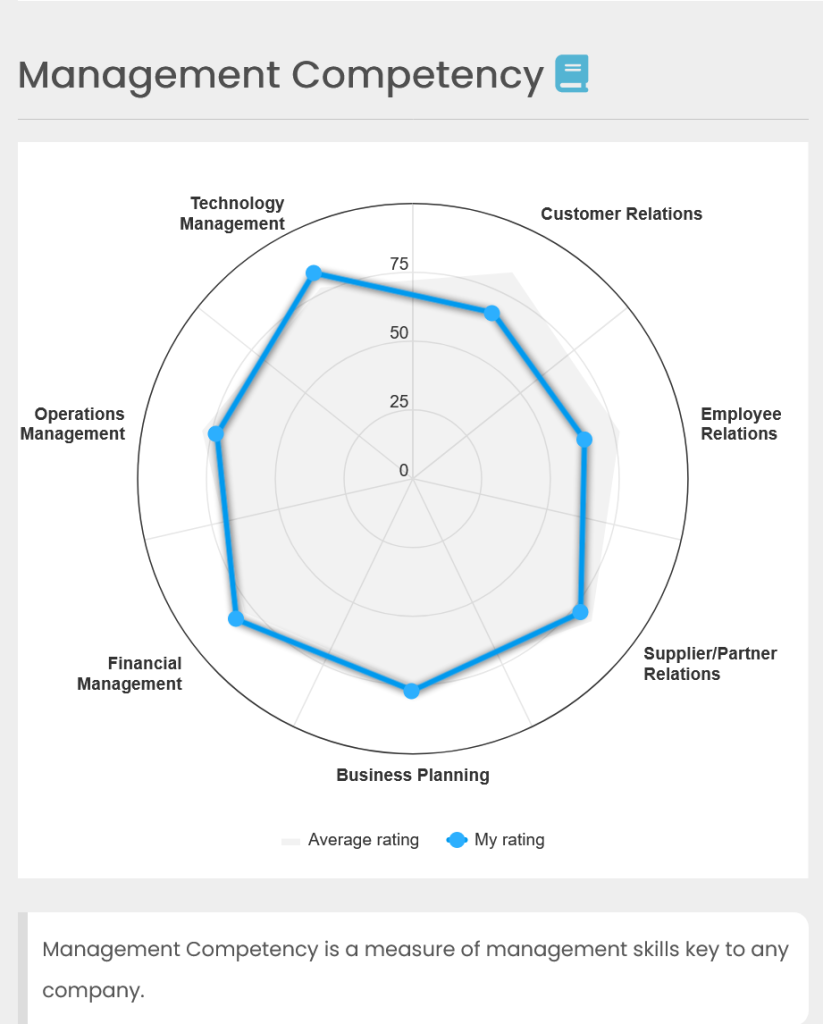
Management Competency
The Management Competency graph allows the company to measure their management skills across a variety of categories, including:
- Technology management
- Operations management
- Financial management
- Business management
- and more
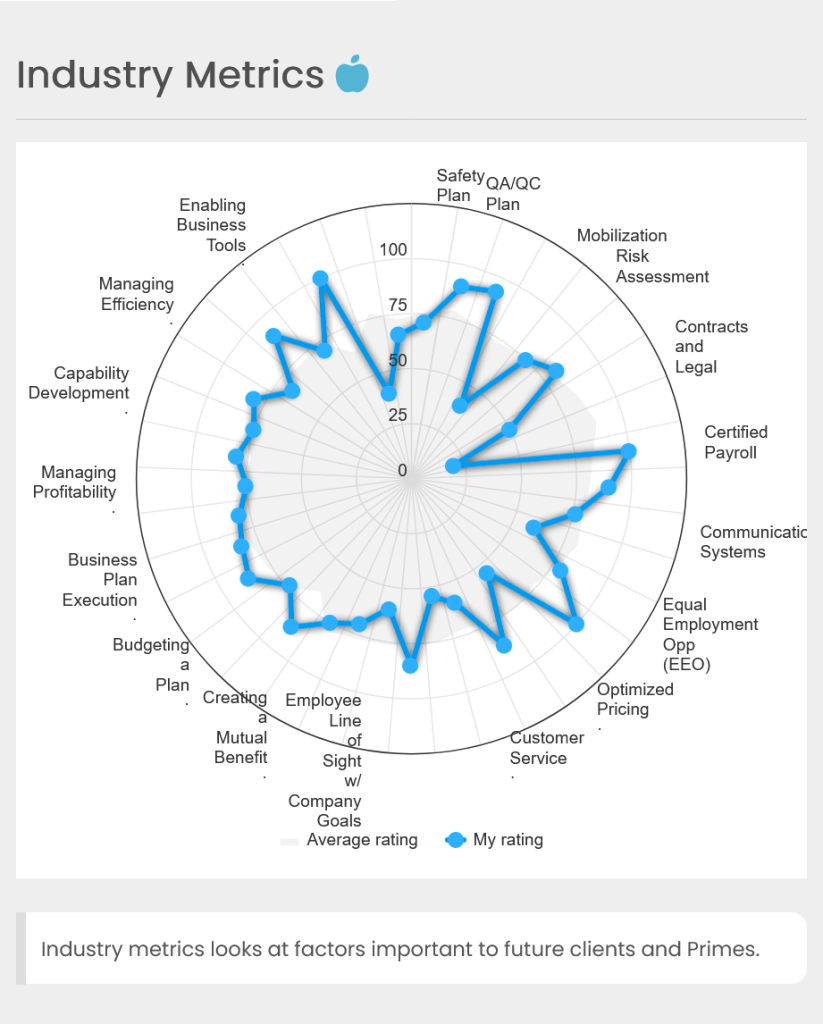
Industry Metrics
The Industry Metrics graph displays important factors relevant to clients and primes, including:
- Enabling business tools
- Safety plans
- Managing efficiency
- Capability development
- Managing profitability
- Business plan execution
- Budgeting and planning
- Creating mutual benefit
- Employee alignment with company goals
- Customer service
- and more
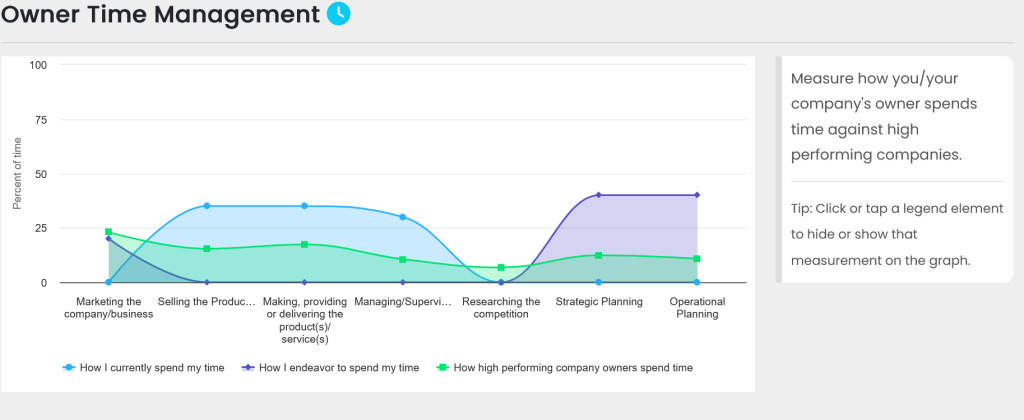
Owner Time Management
The Owner Time Management graph measures how the business owner is spending their time and compares it with other high-performing owners.
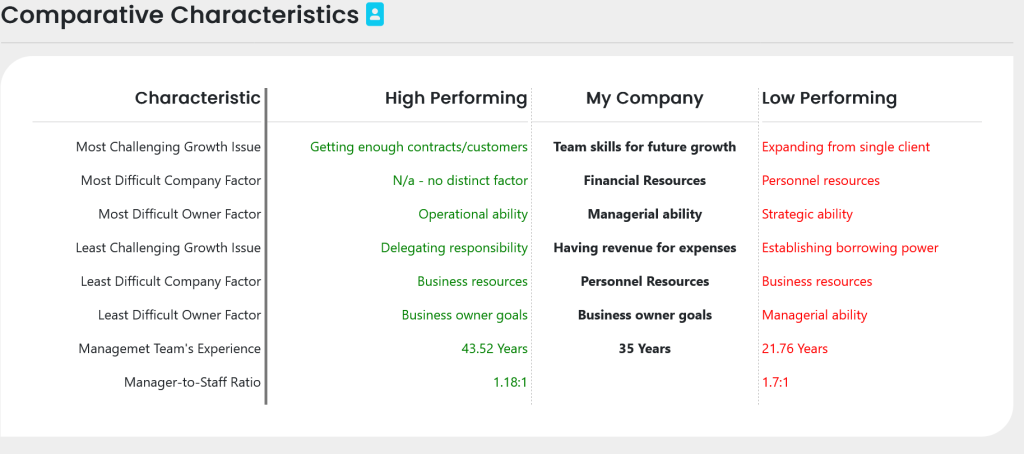
Comparative Characteristics
The Comparative Characteristics section shows a variety of issues that business owners must overcome to achieve growth and success. It allows the business owner to compare issues they are having with those of high-performing and low-performing companies helping to provide context