Interaction Executive Summary
The Interaction Executive Summary provides Affiliates with a high-level view of their analyst team’s annual interaction activity with registered customers.
Navigation
Affiliates can navigate to the Interaction Executive Summary Report view by taking a few steps. First, Affiliates should click the “Reports” navigation menu item in the navigation bar at the top right of their M3 panel.

Once clicked, the Affiliate will be navigated to the Reports view. Affiliates can then click the “Interaction Executive Summary” item in the Reports menu.
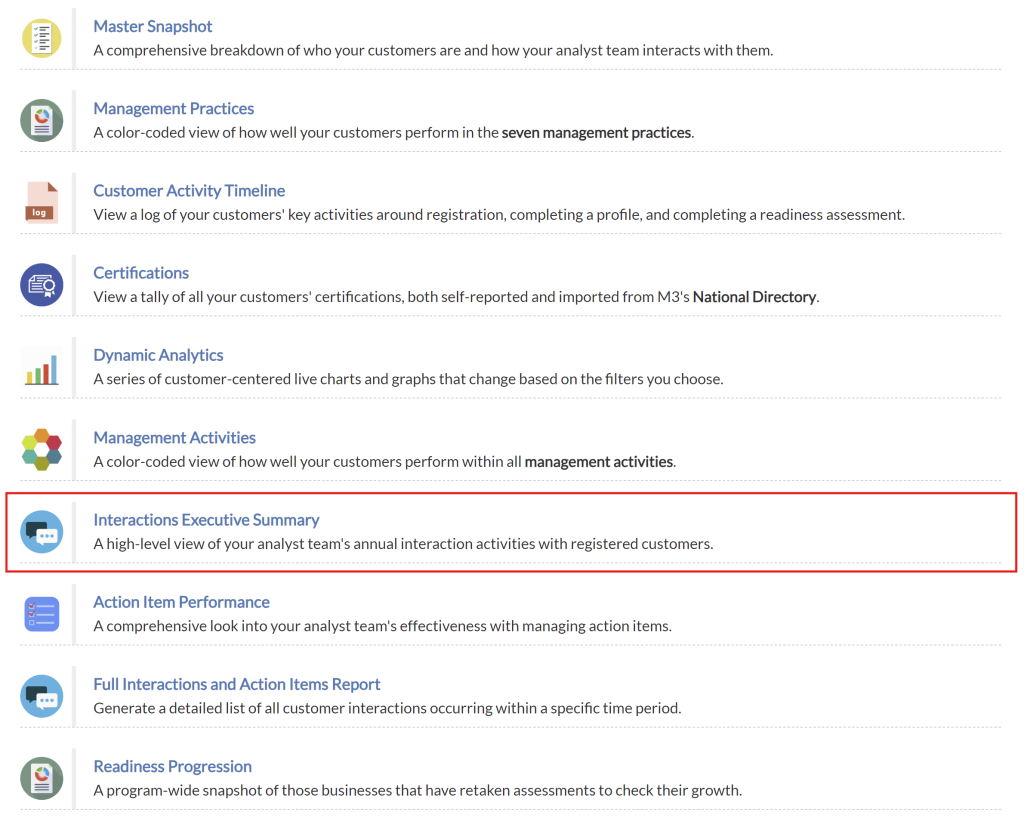
Upon clicking the “Interaction Executive Summary” item in the Reports menu, Affiliates will be navigated to the Interaction Executive Summary view.
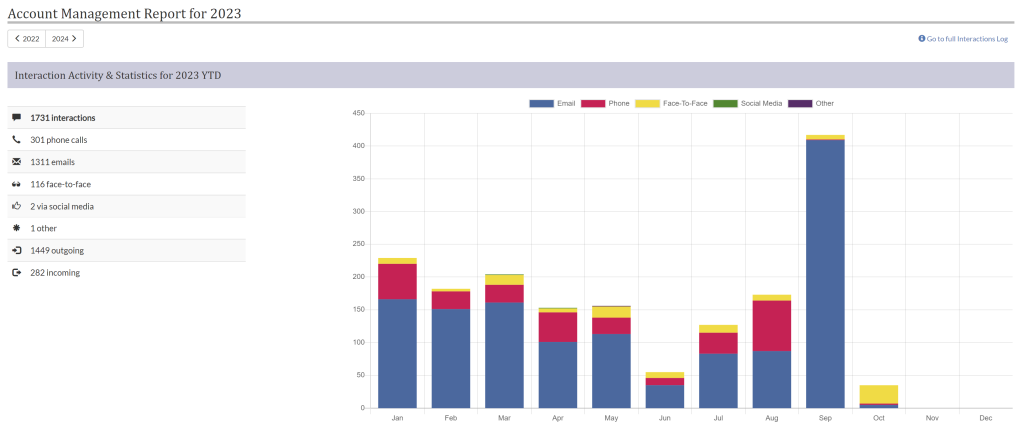
Interactions Range Selector
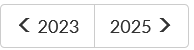
By using the year selector in the top left corner of the table canvas, Affiliates can toggle through different years to display the interactions chart for.
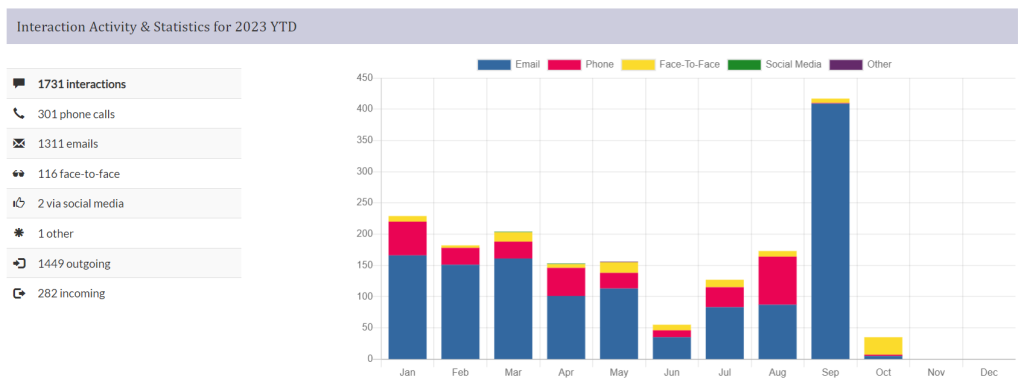
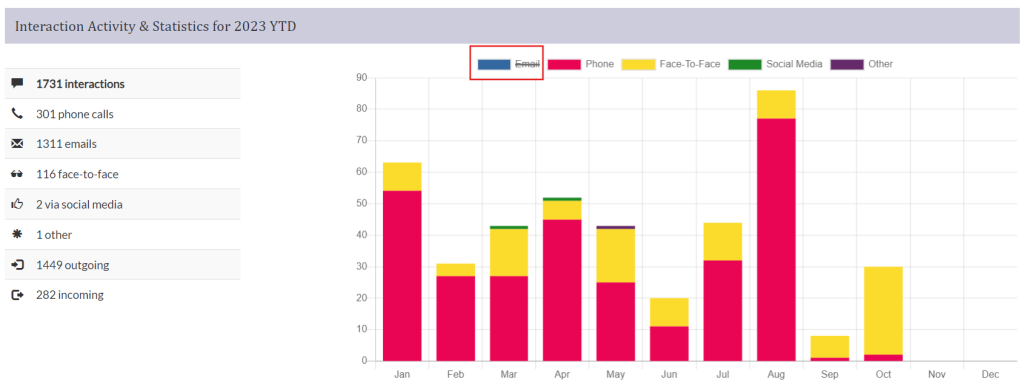
Interaction Activity and Statistics Chart
The Interactions Activity and Statistics chart provides an overview of interactions between affiliates and companies throughout a selected year. Affiliates can use this chart to identify trends in interactions. Affiliates can also toggle the display of interaction sub-categories by clicking on them in the legend key at the top of the chart.